


A commercial market report for Q3 2026 is most useful when it separates office leasing, property sales and incoming supply into distinct measures. As a dated reference point, Savills reported average Dubai office rents of AED 238 per sq ft, stable quarter-on-quarter, in Q1 2026.
Key takeaways
| Indicator | How to read it |
|---|---|
| Geography and period | Keep Dubai, UAE-wide and international figures separate, and label the comparison period. |
| Office conditions | Read absorption, vacancy, occupancy and achieved rents together. |
| Sector performance | Use measures suited to offices, retail, industrial property and multifamily housing. |
| Sales and leasing | Sales describe changes in ownership; leasing describes occupier decisions. |
| Next-quarter view | Test several scenarios and update the view as new evidence arrives. |
For broader investor context, see our Dubai investment resources and Dubai real estate investment guide. For a closer look at future supply, our off-plan guide explains how to assess projects and payment plans.
Geography and reporting periods define the scope
Start by identifying the market each figure describes. Dubai, the wider UAE and an international comparison are different geographies, so their metrics cannot be combined into one conclusion about local demand.
Then check the period. A quarter-on-quarter change compares adjacent quarters, while a year-on-year change compares the same quarter across two years. A report based on a shorter window within the quarter may capture a different pattern from a full-quarter result.
Transaction counts, sales values and leasing volumes also need separate labels. A count records how many transactions took place, a sales value totals the amount traded, and leasing volume describes space leased; each measures a different kind of activity.
The Market Reports resource provides monthly and quarterly reports with Dubai transaction data, price analysis and investment insights. It is a useful starting point when you need to establish the reporting period and the activity being measured.
Use the report’s stated geography, cut-off date and metric definition as the header for every comparison you make.
Office leasing, vacancy and absorption show occupier pressure together
Net absorption measures the change in occupied office stock over a period. Positive absorption means occupied space has grown; it does not count the number of leases signed.
Read absorption alongside vacancy and occupancy. In a simple stock measure, the vacancy rate is vacant space divided by the tracked inventory. Falling vacancy combined with positive absorption gives stronger evidence of tightening conditions than a high leasing volume on its own.
Savills reported that 97% of Dubai office transactions in Q1 2026 were for spaces below 3,000 sq ft. The same Q1 2026 report said office rates were 14% higher year-on-year and availability remained tight across the city, according to Savills.
Asking rent and achieved rent describe different stages of a lease. Compare achieved rents for similar locations, building quality and fit-out, and account for incentives or other terms that can change the tenant’s total cost.
Compare completions with space taken up by occupiers. For an office-specific investment example, read our The Yards Plaza Investment Case; the project page gives a separate asset-level view from market-wide leasing measures.
For an office decision, record absorption, vacancy, achieved rent and new completions as separate lines in the same period.
Each property sector needs its own performance measures
For offices, focus on leasing activity, net absorption, vacancy, occupancy, achieved rents and the quality of available space. A single leasing total says little about whether the space is in a location or condition that suits the occupier.
Retail property needs a different read. Track tenant demand, occupancy, rental performance and the mix of uses; office leasing volume does not measure retail leasing conditions or trading activity.
For industrial and logistics property, compare rents and occupancy with new supply, location and suitability for warehouse or distribution use. A unit’s layout and access can shape its use even when its rent resembles another asset’s.
Keep multifamily housing in a residential analysis. Residential rent and occupancy can inform that sector, while office conclusions need office evidence. Our Dubai rental yields analysis covers residential measures, and our area directory and Dubai area comparison provide location context.
For residential comparisons, our guides to JVC, Dubai Hills Estate and Al Jaddaf Waterfront describe separate locations; they should sit alongside residential evidence, not office measures.
Choose the indicators to match the asset’s use before comparing sector performance.
Twelve chapters on what the regional war tested, the balance sheet and dollar peg behind the market, and how to pick the right side of this cycle.
Download free→Sales activity measures ownership changes, leasing measures occupation
Separate off-plan sales from secondary-market resales. Off-plan activity records purchases of future supply, while a resale records an existing asset changing hands. Our Dubai off-plan property listings and payment-plan analysis address purchase structures and project terms.
Read transaction counts with sales values and asset types. A change in total value can come from the size or mix of properties traded, so it does not by itself establish a change in prices.
Leasing activity records occupier decisions; sales activity records asset ownership changes. Capital-markets activity adds another view of investment conditions, while leaving tenant demand and day-to-day operating performance to their own measures.
Budget acquisition costs separately from the purchase price when reviewing a transaction.
When reviewing a transaction report, label each sale as off-plan or resale and keep leasing totals in a separate category.
Rent, asset quality and the supply pipeline explain pressure
Compare like-for-like rental evidence. Fitted office space includes a completed interior for occupation, while shell-and-core space requires the tenant to complete the fit-out, which changes both the rent comparison and the tenant’s initial costs.
Knight Frank recorded an average leasing rate of AED 248 per sq ft for fitted space, while Knight Frank recorded AED 207 per sq ft for shell-and-core space. Keep the two categories separate when comparing rents.
Read rent movements with vacancy, occupancy and absorption. A rent rise on its own cannot show whether demand has spread across the market or reflects a smaller group of locations and buildings.
Savills reported that approximately 2,000,000 sq ft of office space was expected to be delivered in Dubai in 2026. Knight Frank projected that Dubai’s total office gross leasable area would expand by 13.2 million sq ft by 2030.
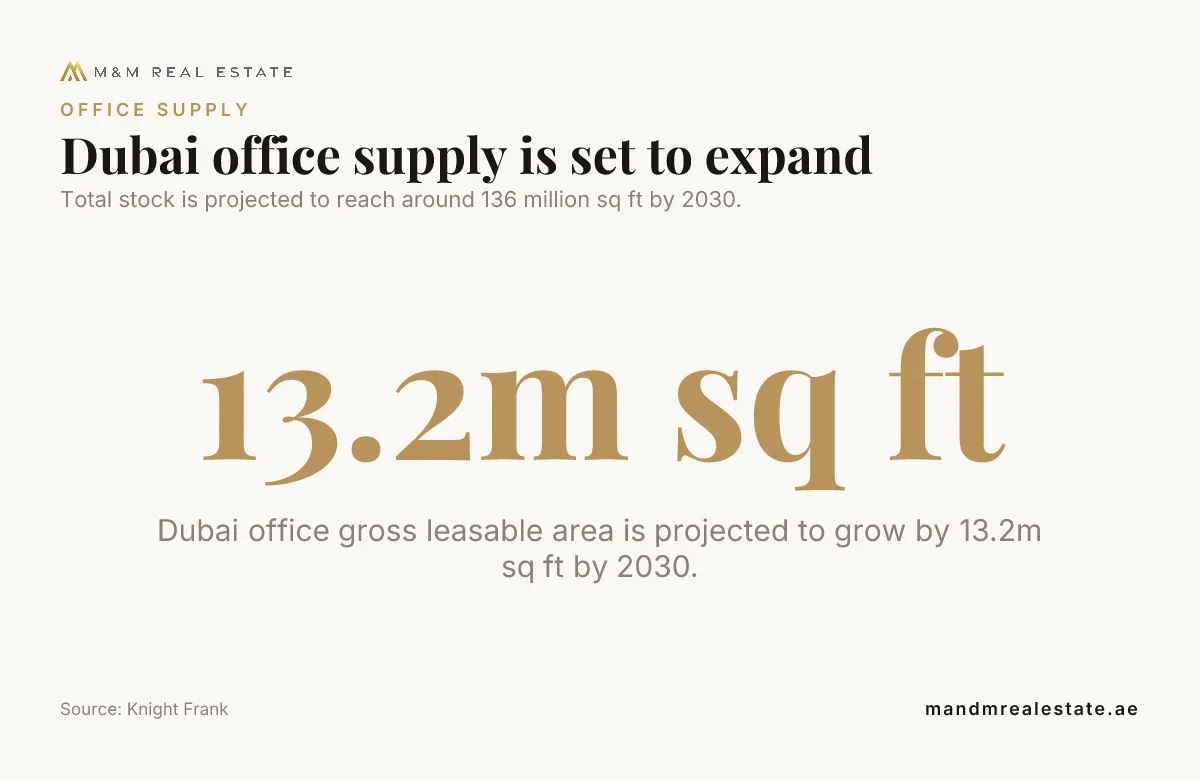
Total stock is projected to reach around 136 million sq ft by 2030.
Source: Knight Frank
Track the timing and type of planned completions as well as total area, since supply affects sectors and locations differently. Building quality, layout and location also shape whether incoming space suits likely occupiers.
For developer and delivery context, compare the company’s record and project structure through our Dubai developer profiles and developer comparison. Match rent evidence to the asset’s fit-out and location before using it in an acquisition decision.
Use Q3 evidence to frame next-quarter scenarios
Build an outlook from signals that agree. Positive absorption, lower vacancy, achieved rent growth and leasing activity together give a fuller view than a single headline metric.
Include financing and refinancing conditions in the same review as rents and occupancy. Borrowing costs affect acquisition capacity, debt repayment and the choice to hold or sell an asset.
Set out scenarios for delayed completions, weaker occupier take-up and changing financing costs. For each case, name the next leasing, transaction or completion measure that would strengthen or weaken that view.
Capital raising also has its own measures. Our Dubai real estate crowdfunding guide covers a different route to property exposure, separate from commercial tenant demand.
If a commercial purchase also forms part of a wider residence or tax plan, read our separate guides to the Dubai property Golden Visa and Dubai property tax. This is general information, not tax or legal advice.
Revisit the Q3 assessment as later leasing, transaction and completion evidence arrives. A single quarter describes conditions during its reporting period and gives a basis for testing the next decision.
See also: The Yards Plaza by BEYOND, City of Arabia Offices, Dubai population growth is reshaping how the city plans for residents.
What to do next
Before acting on a Q3 2026 commercial market report, record its geography, cut-off date and definitions for leasing, vacancy and transactions. Ask the developer for the completion schedule and the space specification, then budget acquisition costs and refinancing payments against a range of operating outcomes.
An M&M advisor will go through your asset type, reporting cut-off and next-quarter decision with you. Contact us.
Figures are past data from the sources named; this article is general information and not tax, legal or financial advice, and returns are not guaranteed.

Why can two commercial market reports show different transaction totals for the same quarter?
They may count different stages of a deal, so compare each report’s transaction definition before reading the difference as a change in activity.
How do lease incentives affect comparisons between headline and effective rent?
Calculate the rent after allocating each concession across the full lease term, then compare that figure with the headline rate.
What does it mean if office vacancy rises while rents also increase?
Check whether vacancy and rent cover the same buildings and period; mismatched coverage can make the two indicators appear to conflict.
How should an investor stress-test a commercial property purchase against refinancing costs?
Model the loan repayment under several borrowing-cost assumptions and compare each case with the property’s net operating income. Include the loan maturity date, refinancing fees and a lower valuation case in the same review.


